
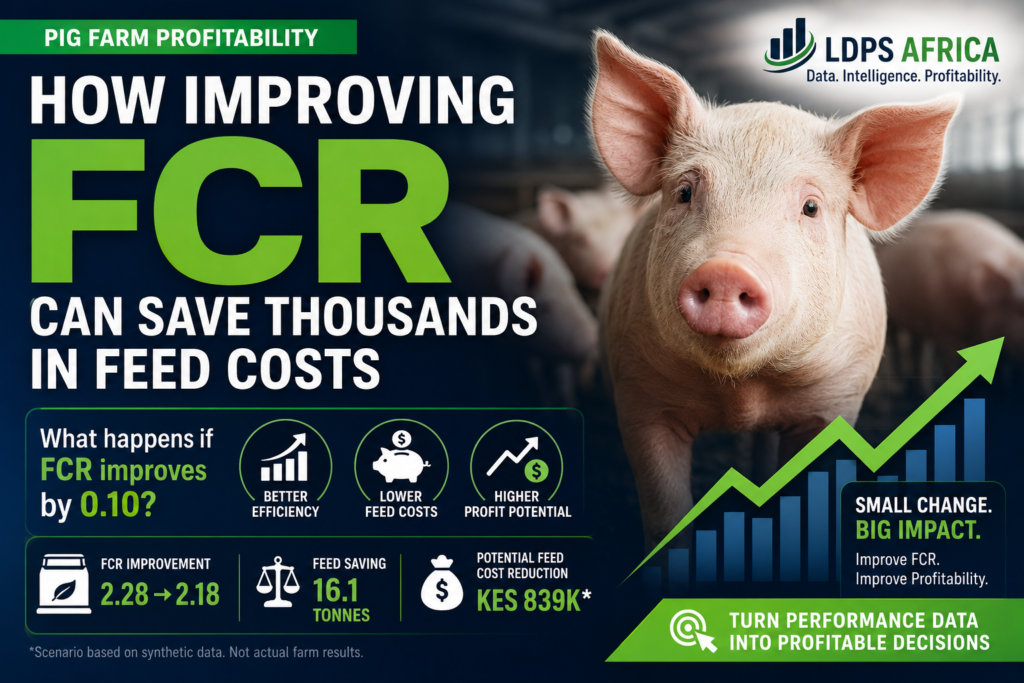
Pig FCR and Profitability: How a 0.10 Improvement Can Reduce Feed Costs
Feed is one of the most important economic drivers in commercial pig production. When feed conversion deteriorates, a farm can spend substantially more money producing the same amount of pork.
That is why feed conversion ratio (FCR) is more than a technical production KPI.
It is an economic KPI.
A small improvement in FCR can translate into a significant reduction in feed required to produce the same amount of liveweight gain.
But there is an important distinction:
A better FCR creates economic potential. It does not automatically create realized profit.
To understand the difference, consider a practical commercial finishing-pig example.
What Is FCR in Pig Production?
FCR means Feed Conversion Ratio.
The simplified formula is:
FCR = Total Feed Eaten ÷ Total Weight Gained
For example, if pigs consume 100 kg of feed and collectively gain 40 kg of liveweight:
FCR = 100 ÷ 40 = 2.50
This means the pigs required approximately 2.50 kg of feed to produce 1 kg of liveweight gain.
In general:
Lower FCR = better feed efficiency
provided that the comparison is made using the same:
- production system
- measurement methodology
- production period
- animal category
- feed basis
- weight basis
FCR should therefore never be interpreted in isolation.
Why Does FCR Matter Economically?
Suppose two pig farms produce exactly the same amount of liveweight gain.
Farm A has an FCR of:
2.28
Farm B improves to:
2.18
The difference is only:
0.10 FCR points
At first glance, 0.10 may appear small.
But the economic effect depends on the total amount of weight the farm produces.
The greater the total weight gain, the more important a small FCR improvement becomes.
A Practical Pig Farm FCR Example
For this analysis, we use a synthetic finishing-pig dataset from an LDPS livestock performance exercise.
Farm scenario
| Metric | Value |
|---|---|
| Pigs placed | 2,000 |
| Pigs marketed | 1,916 |
| Starting weight | 28 kg |
| Final weight | 112 kg |
| Feed consumed | 367,000 kg |
| Mortality | 4.2% |
| Days on feed | 111 days |
| Feed price | KES 52/kg |
| Selling price | KES 210/kg |
This is synthetic test data, not customer farm data.
The purpose is to demonstrate how livestock performance data can be translated into an economic scenario.
Calculate Weight Gain
The average pig starts at:
28 kg
and finishes at:
112 kg
Therefore:
Weight gain = Final weight − Starting weight
112 − 28 = 84 kg
Each marketed pig has therefore gained approximately:
84 kg
Calculate ADG
Average Daily Gain, or ADG, measures how much weight the animal gains per day.
The simplified formula is:
ADG = Weight gained ÷ Days
Therefore:
84 kg ÷ 111 days
= 0.757 kg/day
or approximately:
757 g/day
ADG is important because growth rate affects:
- days to market
- housing utilization
- feed consumption
- production turnover
- cost per pig
- overall profitability
Calculate Mortality
The farm placed:
2,000 pigs
Mortality was:
4.2%
Therefore:
2,000 × 4.2% = 84 pigs
Pigs remaining:
2,000 − 84 = 1,916 pigs
Therefore:
Pigs marketed = 1,916
This is important for economic analysis because animals placed and animals marketed are not the same economic denominator.
Calculate FCR
The simplified LDPS teaching formula is:
FCR = Total Feed Eaten ÷ Total Weight Gained
Total weight gain:
1,916 pigs × 84 kg = 160,944 kg
Feed consumed:
367,000 kg
Therefore:
FCR = 367,000 ÷ 160,944
≈ 2.28
Baseline FCR = 2.28
This means the farm used approximately:
2.28 kg of feed for every 1 kg of liveweight gain
under the calculation methodology used in this exercise.
Calculate Feed Cost per Kilogram of Gain
A simple way to translate FCR into feed economics is:
Feed Cost/kg Gain = FCR × Feed Price/kg
The farm’s feed price is:
KES 52/kg
Therefore:
2.28 × KES 52
≈ KES 118.58/kg gain
So, under this simplified calculation:
Feed cost per kilogram of gain ≈ KES 118.58
What Happens If FCR Improves by 0.10?
Now we reach the most important economic question.
Suppose the farm improves its FCR from:
2.28 → 2.18
That is an improvement of:
0.10 FCR points
We will assume that the farm produces the same total weight gain.
This is important because we want to isolate the effect of FCR.
Feed Required at the Current FCR
Total weight gain:
160,944 kg
Baseline FCR:
2.28
Therefore:
160,944 × 2.28
≈ 367,000 kg of feed
This matches the baseline feed consumption.
Feed Required at an FCR of 2.18
Now apply the improved FCR:
160,944 × 2.18
≈ 350,858 kg
Therefore, the modeled feed requirement falls to approximately:
350,858 kg
Approximate Feed Saving
Baseline feed:
367,000 kg
Scenario feed:
350,858 kg
Therefore:
367,000 − 350,858
≈ 16,142 kg
Potential feed saving ≈ 16.1 tonnes
That is a substantial quantity of feed from what initially appeared to be only a 0.10 FCR improvement.
What Is the Economic Value of the Feed Saving?
Feed price:
KES 52/kg
Potential feed saving:
≈16,142 kg
Therefore:
16,142 × KES 52
≈ KES 839,384
So the modeled scenario indicates approximately:
KES 839,000 of potential feed-cost reduction
assuming:
- the FCR improves from 2.28 to 2.18;
- the same weight gain is achieved;
- feed price remains KES 52/kg;
- feed consumption is measured consistently;
- the improvement is actually achieved and sustained;
- there are no offsetting costs.
But Is KES 839,000 Additional Profit?
No—not automatically.
This is one of the most important lessons in livestock profitability analysis.
The calculation demonstrates:
Potential feed-cost reduction
It does not prove:
Realized net profit
Why?
Because improving FCR may require an intervention.
For example, a farm might spend additional money on:
- feed formulation changes
- feed processing
- feeder improvements
- health interventions
- environmental improvements
- management changes
- diagnostics
- additives
- equipment
- staff training
Those costs must be considered before calculating the actual economic return.
Therefore, a professional livestock analytics system should distinguish:
Scenario value
What could happen if the assumed improvement occurs?
Potential value
What economic opportunity exists based on the modeled improvement?
Realized value
What economic improvement actually occurred after implementation?
Net value
What remains after accounting for the costs of achieving the improvement?
This distinction is critical for credible livestock profitability analysis.
Why Did the FCR Become 2.28?
This is where livestock analytics becomes more valuable than simply calculating KPIs.
An FCR of 2.28 tells us what happened.
It does not automatically tell us why it happened.
Potential causes may include:
1. Feed wastage
Feed may be lost through:
- poorly adjusted feeders
- excessive feeder openings
- spillage
- poor feed handling
- damaged equipment
2. Feed quality
Investigate:
- nutrient specification
- formulation
- ingredient quality
- pellet quality
- fines
- feed consistency
- storage
3. Health
Health problems can reduce:
- feed utilization
- growth rate
- nutrient absorption
- uniformity
4. Environment
Investigate:
- temperature
- ventilation
- humidity
- stocking density
- air quality
5. Water
Water availability and quality can affect feed intake and growth.
6. Genetics
Genetic potential can influence:
- growth rate
- feed intake
- feed efficiency
- carcass characteristics
7. Measurement quality
Before diagnosing anything, verify:
- feed records
- weighing systems
- animal weights
- batch identity
- production dates
- feed inventory
This last point is often overlooked.
Bad data can create a false FCR problem.
Why Data Quality Comes Before Profitability Analysis
Imagine a farm reports:
Starting weight = 115 kg
Final weight = 82 kg
That produces:
Negative weight gain.
A software system should not blindly calculate an ADG from this data.
It should flag:
INVALID DATA
and explain:
Final weight is lower than starting weight. This creates an impossible negative weight gain and prevents reliable calculation of ADG and any dependent FCR or economic metrics.
This is a critical principle in livestock intelligence:
If the underlying data cannot be trusted, the economic conclusion cannot be trusted.
What Data Should a Farm Collect Before Diagnosing FCR?
A good livestock performance analysis should request more than just FCR.
Important supporting data includes:
Production
- pigs placed
- starting weight
- final weight
- pigs marketed
- mortality
- days on feed
- weight variation
Feed
- total feed consumed
- feed price
- feed formulation
- feed phase
- feed wastage
- feeder calibration
- pellet quality
Health
- disease events
- medication
- treatment records
- mortality pattern
- veterinary observations
Environment
- temperature
- ventilation
- humidity
- stocking density
Water
- water intake
- water availability
- water quality
Economics
- selling price
- feed price
- piglet/purchase cost
- medication cost
- labour
- other variable costs
Without this information, a system should be careful about making causal claims.
FCR Improvement Should Become a Decision, Not Just a Number
A farm manager doesn’t ultimately need to know:
“Your FCR is 2.28.”
They need to know:
“What is causing the FCR problem, how much is it costing us, what should we change, and did the change create measurable value?”
That creates a much more powerful workflow:
Data
↓
Validation
↓
KPI
↓
Benchmark
↓
Problem
↓
Economic Loss
↓
Investigation
↓
Intervention
↓
Result
↓
ROI
This is the direction modern livestock performance analytics should take.
The Difference Between a Dashboard and a Decision System
A traditional farm dashboard might tell you:
FCR: 2.28
A more advanced livestock intelligence system should tell you:
FCR: 2.28
Data status: Validated
Compatible benchmark: Currently unavailable
Potential opportunity: A 0.10 improvement could reduce modeled feed requirement by approximately 16.1 tonnes.
Potential feed-cost reduction: Approximately KES 839,000 at the current feed price.
Important limitation: This is a scenario, not realized profit.
Next investigation: Feed wastage, feed quality, health, environment and water.
Required action: Gather additional evidence before selecting an intervention.
That is the difference between reporting data and supporting decisions.
How Livestock Farms Can Use FCR to Improve Profitability
Farm managers should monitor FCR alongside other KPIs rather than treating it as a standalone metric.
A practical performance dashboard might include:
| KPI | Why it matters |
|---|---|
| FCR | Feed efficiency |
| ADG | Growth speed |
| Mortality | Biological and economic loss |
| Days on feed | Production cycle efficiency |
| Feed cost/kg gain | Feed economics |
| Final weight | Market output |
| Uniformity | Batch consistency |
| IOFC | Income after feed cost |
| Margin | Broader profitability |
The goal is not simply to improve one KPI.
The goal is to improve economic performance without creating negative trade-offs elsewhere.
For example, a lower FCR is not necessarily beneficial if it comes at the expense of:
- unacceptable mortality
- lower final weight
- poor welfare
- higher medication costs
- poorer carcass quality
- excessive intervention costs
Therefore:
Optimize the production system, not one number.
A Better Way to Think About Pig Farm Profitability
The most useful question is not:
“What is my FCR?”
It is:
“Where is my farm losing money, why is it happening, what evidence supports the diagnosis, and what intervention can recover measurable value?”
That requires connecting:
Animal performance
Nutrition
Farm management
Health
Economics
Data quality
into one decision framework.
Conclusion
A 0.10 improvement in FCR may look small.
But on a commercial pig farm, the economic impact can be substantial because feed is consumed at large scale.
In our synthetic 2,000-pig example:
Baseline FCR: 2.28
Scenario FCR: 2.18
Potential feed saving: approximately 16.1 tonnes
Potential feed-cost reduction: approximately KES 839,000
But the most important lesson is not the KES 839,000 figure.
The important lesson is that economic value must be tied to evidence.
A credible livestock intelligence system should never jump from:
FCR = 2.28
directly to:
“You will make KES 839,000.”
Instead, it should say:
“If FCR improves by 0.10 while output and other assumptions remain constant, the model estimates approximately 16.1 tonnes less feed would be required, representing approximately KES 839,000 in potential feed-cost reduction at the assumed feed price. This is a scenario estimate, not realized profit.”
Then the real work begins:
What is causing the current FCR?
What intervention is justified by the evidence?
Did the FCR actually improve?
How much economic value was actually created?
That is where livestock data analytics moves from a dashboard to a livestock profitability decision system.
FAQ schema questions
What is FCR in pig production?
FCR, or Feed Conversion Ratio, is the amount of feed required to produce one unit of liveweight gain. A simplified formula is total feed consumed divided by total liveweight gain.
How do you calculate pig FCR?
Use:
FCR = Total Feed Eaten ÷ Total Weight Gained
For example, 367,000 kg of feed divided by 160,944 kg of weight gain gives an FCR of approximately 2.28.
How can I improve FCR in pigs?
Investigate feed wastage, diet quality, feed processing, health, water, environment, genetics, management and measurement accuracy before selecting an intervention.
How much does a 0.10 improvement in FCR save?
The answer depends on total weight gain and feed price. In the synthetic LDPS example, improving FCR from 2.28 to 2.18 reduces modeled feed requirement by approximately 16.1 tonnes, equivalent to approximately KES 839,000 at KES 52/kg feed.
Is lower FCR always better?
Generally, lower FCR indicates better feed efficiency, but it should be evaluated alongside growth, mortality, final weight, health, welfare, feed cost and other production economics.
Is FCR the same as profitability?
No. FCR is a feed-efficiency KPI. It affects profitability but does not represent total farm profit.
What is IOFC in pig production?
IOFC means Income Over Feed Cost. A basic formulation is total revenue minus total feed cost. It should not be confused with net profit.
About LDPS Africa
LDPS Africa is developing a livestock performance and profitability intelligence approach focused initially on commercial swine and poultry production.
The objective is to help livestock businesses move from raw production data to:
Validated Data → KPI Intelligence → Benchmarking → Profit Leakage → Economic Value → Action → Measured Outcome.
For commercial livestock businesses, this means turning farm data into clearer decisions about feed efficiency, animal performance, health, production economics and profitability.
Important: The farm figures used in this article are synthetic demonstration data and should not be interpreted as customer results or industry benchmarks.