Feed Conversion Ratio (FCR) Analysis: How to Identify Your Best and Worst Performing Livestock Pens Like a Consultant
Why Feed Conversion Ratio Matters
Feed is the largest cost in livestock production, often accounting for 60–80% of total production expenses. Whether you are raising poultry, pigs, dairy calves, or beef cattle, understanding Feed Conversion Ratio (FCR) is essential for improving profitability.
Many farmers record feed consumption and weight gain but fail to transform that data into actionable management decisions. This is where FCR analysis becomes a powerful management tool.
In this article, we analyze a simple farm dataset and demonstrate how consultants use FCR to identify top-performing and underperforming livestock pens.
What Is Feed Conversion Ratio (FCR)?
Feed Conversion Ratio (FCR) measures how efficiently animals convert feed into body weight.
Formula:
FCR = Total Feed Consumed ÷ Total Weight Gain
A lower FCR indicates better feed efficiency because animals require less feed to gain the same amount of weight.
Simple Interpretation
- Lower FCR = Better Performance
- Higher FCR = Poorer Performance
- Better FCR = Lower Feed Costs
- Poorer FCR = Reduced Profitability
For example:
- FCR of 2.3 means an animal requires 2.3 kg of feed to gain 1 kg of body weight.
- FCR of 2.8 means an animal requires 2.8 kg of feed to gain 1 kg of body weight.
The animal with an FCR of 2.3 is therefore more efficient and profitable.
Farm Performance Data
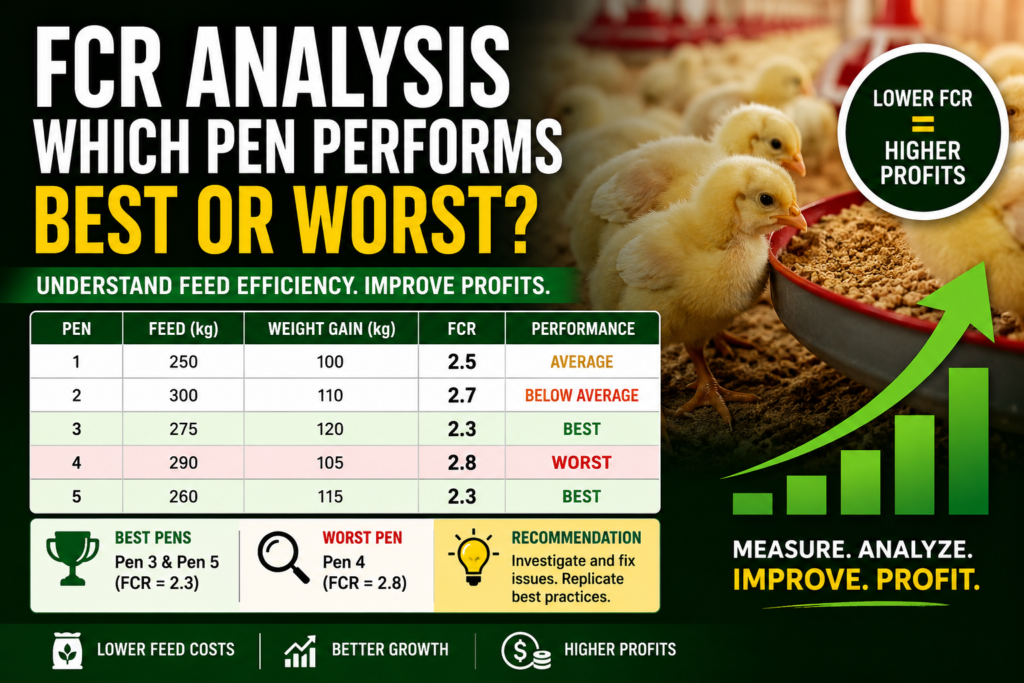
| Pen | Feed (kg) | Weight Gain (kg) | FCR |
| 1 | 250 | 100 | 2.5 |
| 2 | 300 | 110 | 2.7 |
| 3 | 275 | 120 | 2.3 |
| 4 | 290 | 105 | 2.8 |
| 5 | 260 | 115 | 2.3 |
Which Pen Performed Best?
Best Performing Pens: Pen 3 and Pen 5
Both pens achieved an FCR of 2.3, the lowest value in the group.
This means animals in these pens required only 2.3 kg of feed to gain 1 kg of body weight.
Why Is This Important?
Lower feed usage for the same growth translates into:
- Lower feed costs
- Better feed efficiency
- Improved profitability
- Greater return on investment
From a business perspective, Pens 3 and 5 generated the highest value from every kilogram of feed consumed.
Which Pen Performed Worst?
Worst Performing Pen: Pen 4
Pen 4 recorded an FCR of 2.8, the highest among all pens.
This means animals consumed more feed while achieving less weight gain compared to the other groups.
Why Does This Matter?
A higher FCR increases production costs because more feed is required to produce the same amount of growth.
In commercial livestock production, even a small increase in FCR can significantly reduce profits.
Thinking Like a Livestock Consultant
A consultant does not stop at identifying the best and worst performers.
The next question is:
Why did Pen 4 perform poorly?
Several factors may explain the difference.
1. Poor Feed Quality
Low-quality feed may contain inadequate nutrients, reducing animal growth and feed efficiency.
2. Disease Challenges
Sick animals use nutrients to fight infections rather than support growth.
3. Feed Wastage
Improper feeder adjustment can result in substantial feed losses.
4. Water Problems
Animals require continuous access to clean water for efficient feed utilization.
5. Heat Stress
High temperatures reduce feed intake and growth performance.
6. Overcrowding
High stocking densities create stress and competition for feed and water.
7. Genetic Differences
Some animals naturally convert feed into body weight more efficiently than others.
Feed Conversion Ratio Performance Report
Executive Summary
Average Farm FCR
2.52
Best Performing Pens
- Pen 3 – FCR: 2.30
- Pen 5 – FCR: 2.30
These pens demonstrated the highest feed efficiency, requiring only 2.3 kg of feed to produce 1 kg of weight gain.
Worst Performing Pen
- Pen 4 – FCR: 2.80
This pen required the greatest amount of feed per kilogram of weight gain, resulting in increased production costs.
Potential Causes of Poor Performance in Pen 4
The following areas should be investigated:
- Feed wastage
- Poor feeder adjustment
- Health or disease challenges
- Inadequate water access
- Heat stress
- Poor ventilation
- Overcrowding
Recommendations for Farm Managers
To improve overall farm performance:
Conduct a Pen 4 Investigation
Review:
- Feed quality
- Health records
- Water availability
- Ventilation systems
- Stocking density
- Feeder management practices
Benchmark Against Top Performers
Study the management practices used in Pens 3 and 5 and replicate successful strategies across all pens.
Monitor FCR Regularly
Track FCR weekly or monthly to identify performance issues before they become costly problems.
Use Data for Decision-Making
Farm profitability improves when decisions are based on measurable performance indicators rather than assumptions.
Final Consultant’s Conclusion
Pens 3 and 5 established the farm’s performance benchmark with an FCR of 2.3, demonstrating superior feed utilization and profitability potential.
Pen 4 recorded the weakest performance with an FCR of 2.8 and should be prioritized for investigation.
The most profitable farms do not simply produce animals—they continuously measure, analyze, and improve feed efficiency. By monitoring Feed Conversion Ratio and addressing factors that reduce performance, producers can lower feed costs, improve growth rates, and maximize returns on investment.
Remember: What gets measured gets managed, and what gets managed gets improved.